A little LLM lab on the DGX Spark
For a while I wanted to run a serious model at home — one I could actually point my tools at, watch it work, and not think about. Not a cloud endpoint I pay per token, and not a laptop that chokes. Just: a model, a clean way to talk to it, and a dashboard I could trust.
That’s what ended up living on my DGX Spark. A single desktop box, quiet enough to sit on a desk, now runs a 27B-class model and serves it the way my tools expect — and the whole thing is described in one config file.
The stack, in plain terms
The short version: sparkrun manages the containers that run the model — it takes a recipe (a file that says which inference engine serves the model and how), and it handles the containers, the recipes, the networking, and clustering across multiple Sparks. This box runs the SGLang recipe; want vLLM, or some other engine? That’s a different recipe, not a rewrite. LiteLLM sits in front as the thing I actually talk to — it hands out API keys, tracks spend, and gives the model a stable name that survives me swapping models underneath. Prometheus scrapes metrics from the model, the GPU, and the host, and Grafana turns that into dashboards I can actually read. Tailscale lets me reach the gateway from any of my machines over a private mesh; a Cloudflare Tunnel is there if I ever want to share it with a friend.
Nothing here is exotic. The interesting part is how little I have to manage.
One config, one command
Instead of a pile of copy-pasted scripts, everything is generated from a single
config.yaml. Pick the recipe — which engine serves the model — the ports,
which dashboards you want, whether you want the tunnel on. Then:
$ spark-lab init
$ spark-lab apply
apply is the part I like. It’s declarative: it renders the whole stack from your
config, works out what actually changed since the last time you ran it, and only
touches that. Change the model, add a dashboard, bump a port — run apply again and
the node converges to the new state. No more “which of the three files did I edit,
and which service do I need to restart?”
Here it is actually running — SGLang up, and the gateway plus its supporting services healthy:
$ sparkrun status
Job: recipes/qwen38-27b-dspark-nvfp4.yaml  [62cafcefd78a4fcf]  (1 container)
  solo       127.0.0.1                                 Up 27 hours   lmsysorg/sglang:qwen38-27b
  logs: sparkrun logs 62cafcefd78a4fcf
  stop: sparkrun stop 62cafcefd78a4fcf

Total: 1 container(s) across 1 host(s)

$ docker compose ps
NAME                     SERVICE          STATUS
litellm-litellm-1        litellm          Up 7 hours        0.0.0.0:4000->4000/tcp
litellm-db-1             db               Up 43 hours (healthy)
litellm-redis-1          redis            Up 43 hours (healthy)  0.0.0.0:6379->6379/tcp
litellm-prometheus-1     prometheus       Up 42 hours       0.0.0.0:9090->9090/tcp
litellm-grafana-1        grafana          Up 43 hours       0.0.0.0:3000->3000/tcp
litellm-node_exporter-1  node_exporter    Up 31 hours       0.0.0.0:9100->9100/tcp
litellm-dcgm_exporter-1  dcgm_exporter    Up 42 hours       0.0.0.0:9835->9835/tcp
And the GPU is doing work — two processes, the model and its scheduler:
$ nvidia-smi
|   0  NVIDIA GB10                    On  |  0000000F:01:00.0 Off |       N/A |
| N/A   66C    P0             43W /  N/A  |  Not Supported        |    96%    |
+-----------------------------------------------------------------------------------------+
| Processes:                                                                              |
|    0   N/A  N/A         925214      C   /usr/bin/python3                        6316MiB |
|    0   N/A  N/A         926002      C   sglang::scheduler                       10223MiB |
(That Not Supported for memory is the GB10 being honest with you: the GPU shares
unified memory with the host, so it doesn’t report a fixed VRAM number the way a
discrete card would. The monitoring stack accounts for that.)
What you get
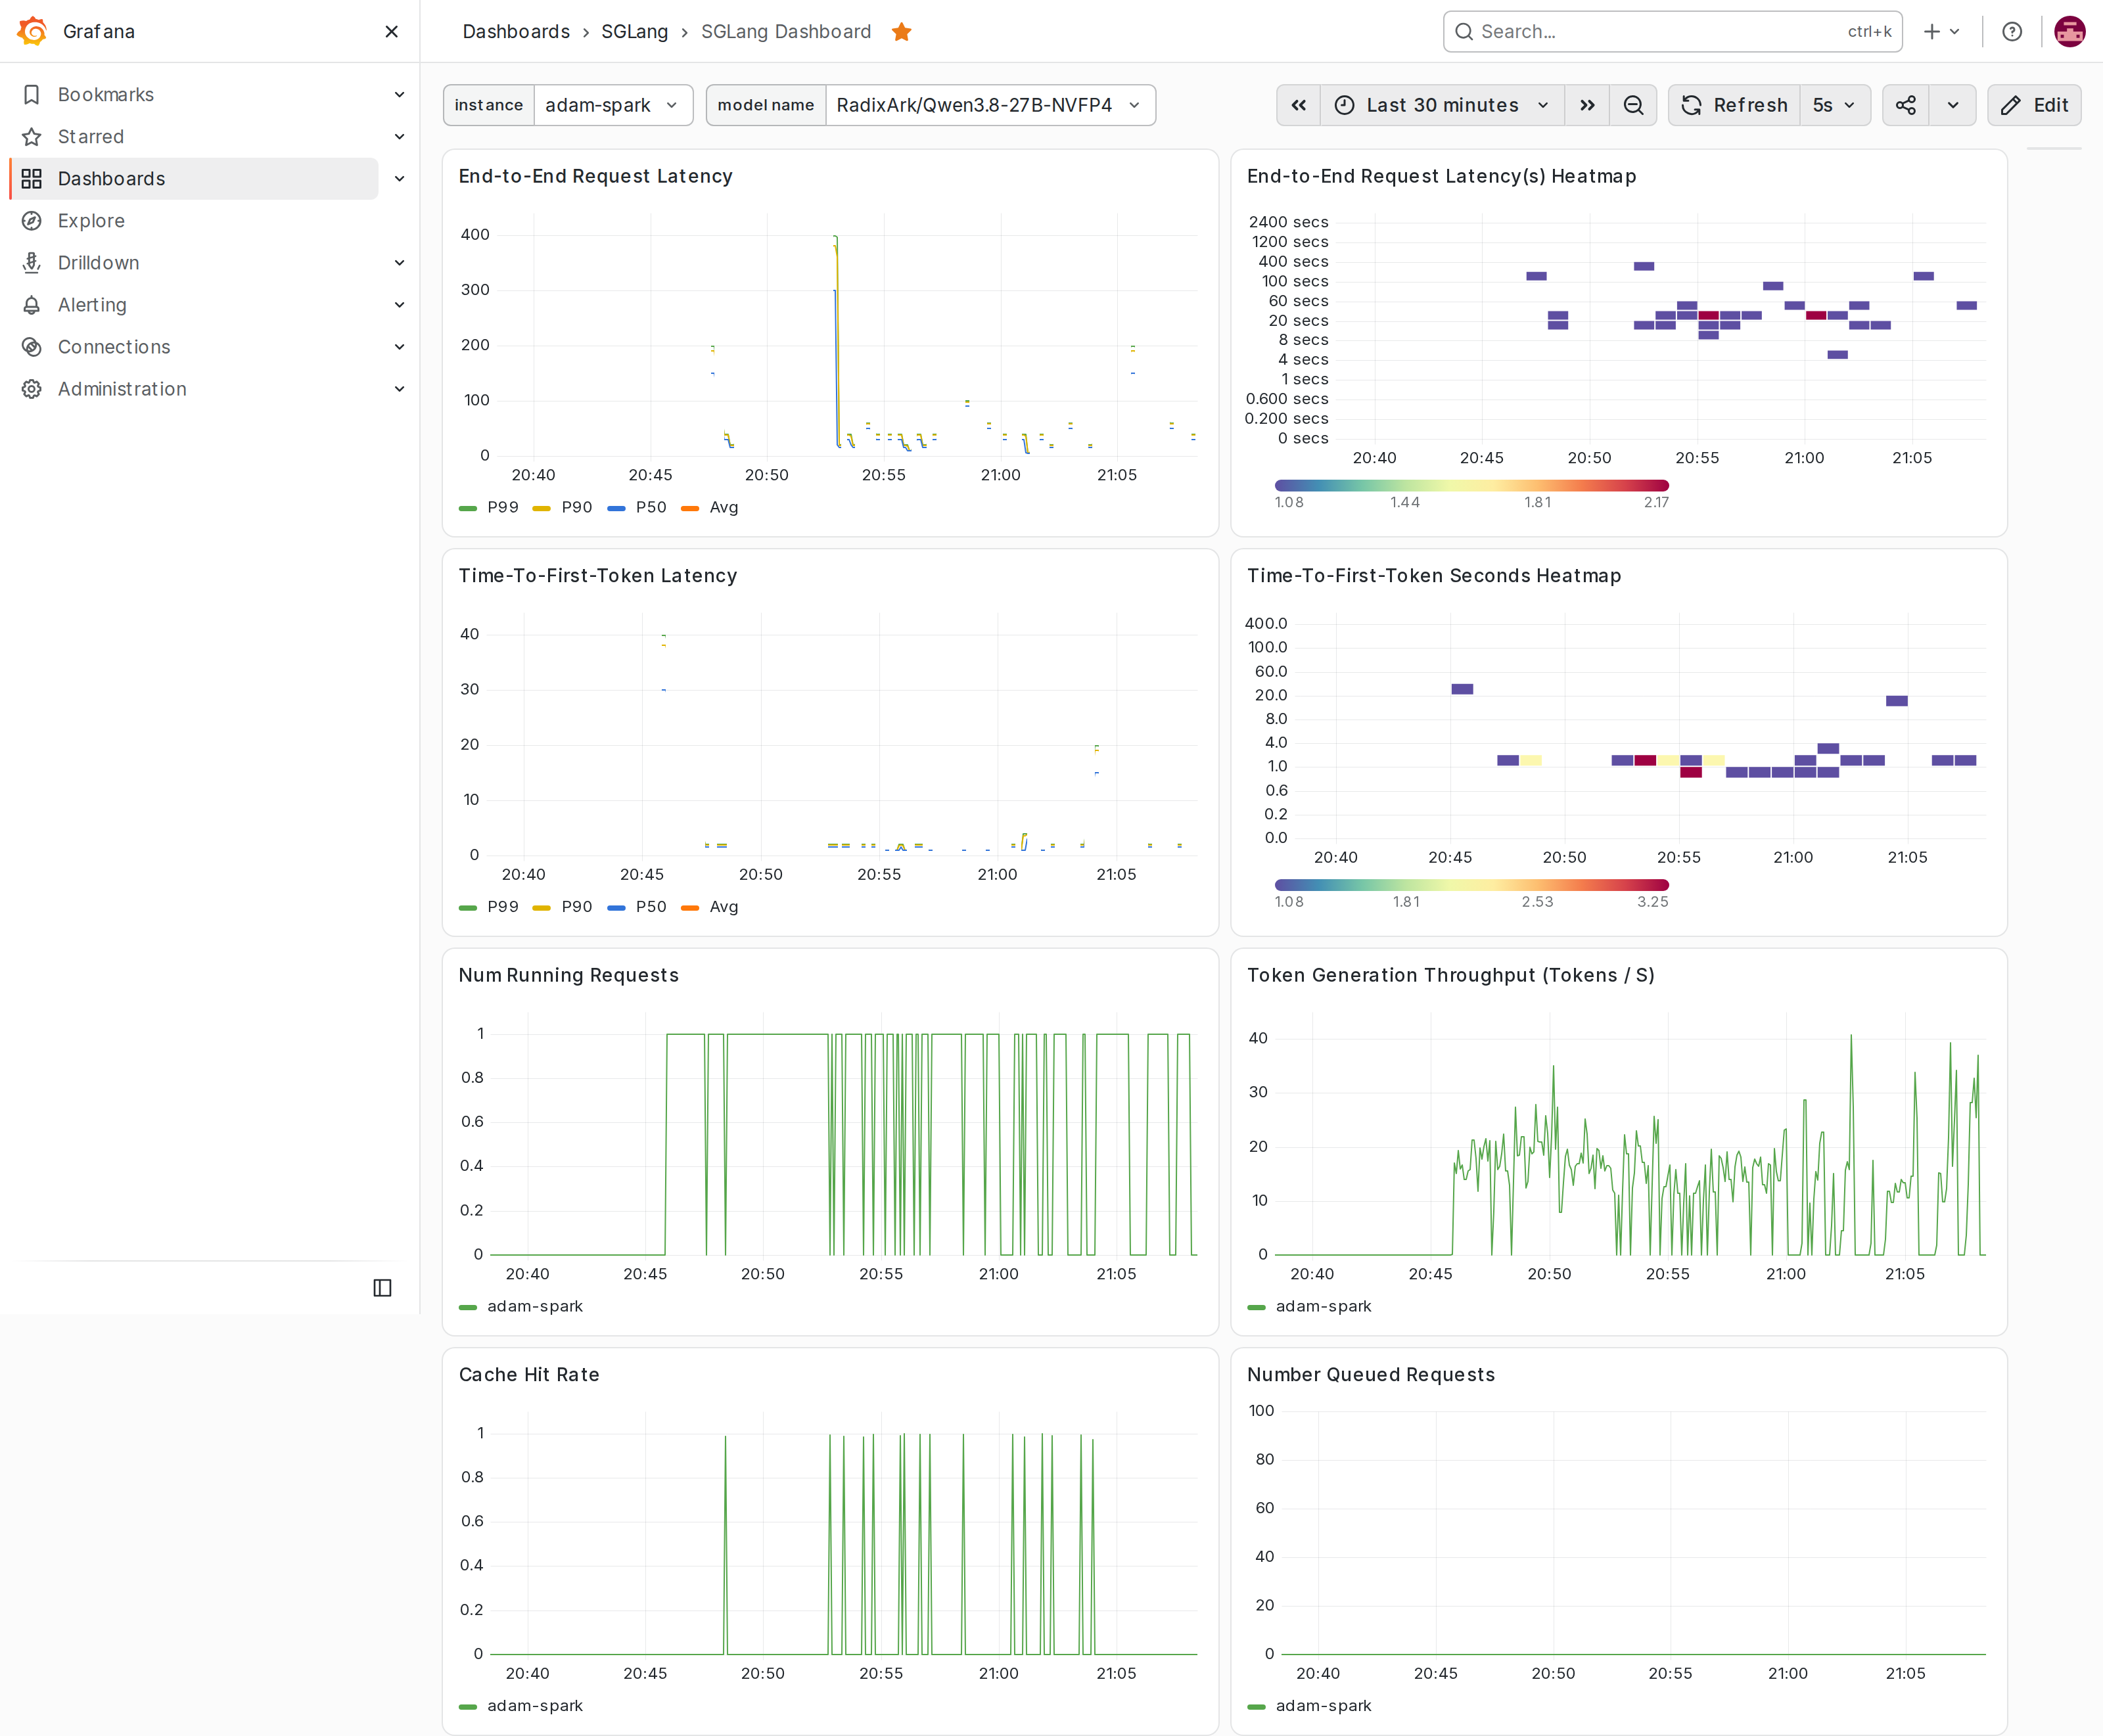
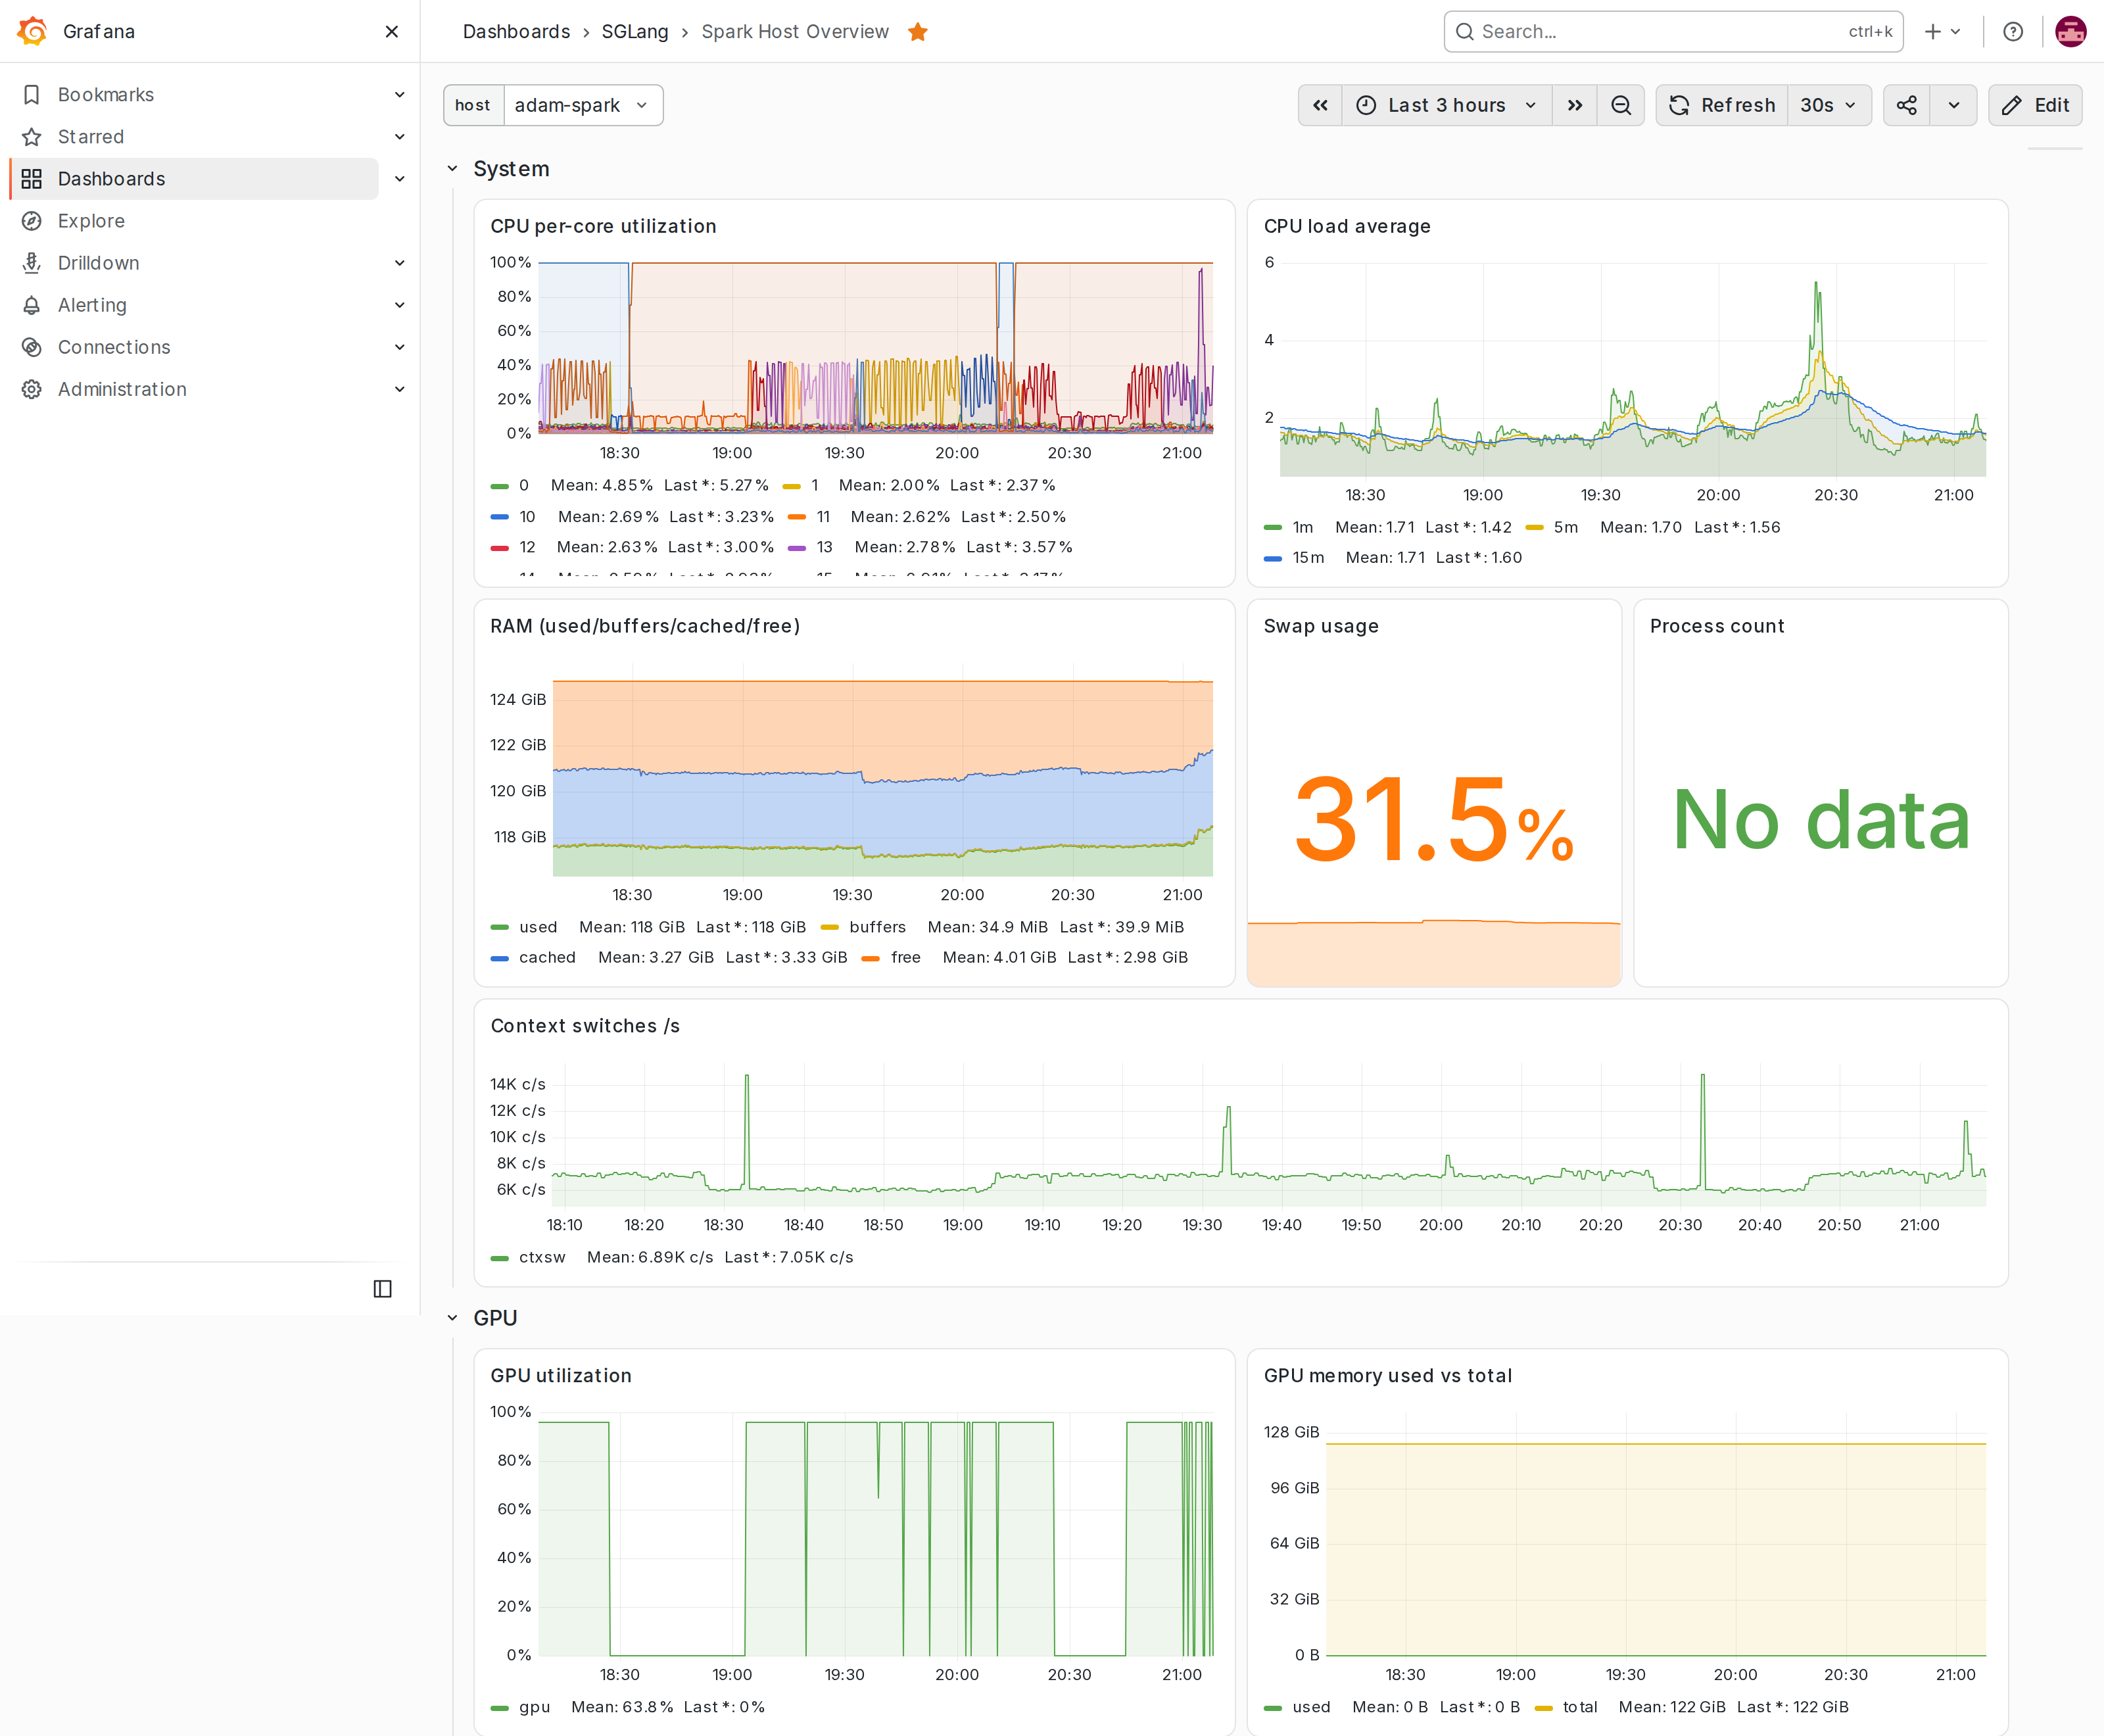
A Grafana you can actually read is the payoff. There’s an SGLang dashboard — request latency, time-to-first-token, throughput, queue depth, cache-hit rate — and a host-overview one tuned for the GB10.
Reaching the model is just “point any OpenAI-compatible client at the gateway with your key”:
curl http://<your-spark>:4000/v1/models -H "Authorization: Bearer $LITELLM_MASTER_KEY"Over Tailscale it’s even simpler — the Spark shows up on the mesh like any other device, so any of my laptops can use the model without a single open port:
$ tailscale status
100.71.216.115   my-spark     linux
100.86.52.50     pop-os       linux    active; direct
100.77.2.33      startos      linux
If I did want to share it publicly, the Cloudflare Tunnel is the escape hatch — front the gateway with a token and hand out a LiteLLM key. I keep that off by default, because “I can share a model with a friend” and “the model is public” are very different sentences.
Run it on your own
If you’ve got a DGX Spark — or a rack of them; sparkrun clusters across nodes,
and the whole lab scales with it — clone the repo, spark-lab init, pick a
recipe for your model, and spark-lab apply.
It’s MIT-licensed, and it’s just me tidying up a setup I actually use — so expect it to read more like a well-organized toolbox than a product. The docs cover the architecture, day-2 operations, model recipes, and networking.
Two Sparks, one lab
This post is about one box. I have a second Spark on the same tailnet, and the next step is having it join the lab: bigger models that don’t fit on a single machine, split across two, behind the same gateway. I’ll write up how that goes when it’s actually running.